
SirBillybob
-
Posts
3,655 -
Joined
-
Last visited
Content Type
Forums
Donations
News
Events
Gallery
Everything posted by SirBillybob
-
… target one personally, it’s all worth it. Though the incontinence applies, one is well past menopause.

-

Return to Montreal...some practical stuff
+ SirBillybob replied to + newatthis's topic in Male Strip Clubs
Oh, makes sense as neighbours and much mutual movement. I thought it might be international and ease return home. I don’t travel to USA. -
Return to Montreal...some practical stuff
+ SirBillybob replied to + newatthis's topic in Male Strip Clubs
Can somebody in return please briefly relay whether this Nexus thing or an equivalent applies to a Canadian like me, making travelling easier, and what is the process? -
Return to Montreal...some practical stuff
+ SirBillybob replied to + newatthis's topic in Male Strip Clubs
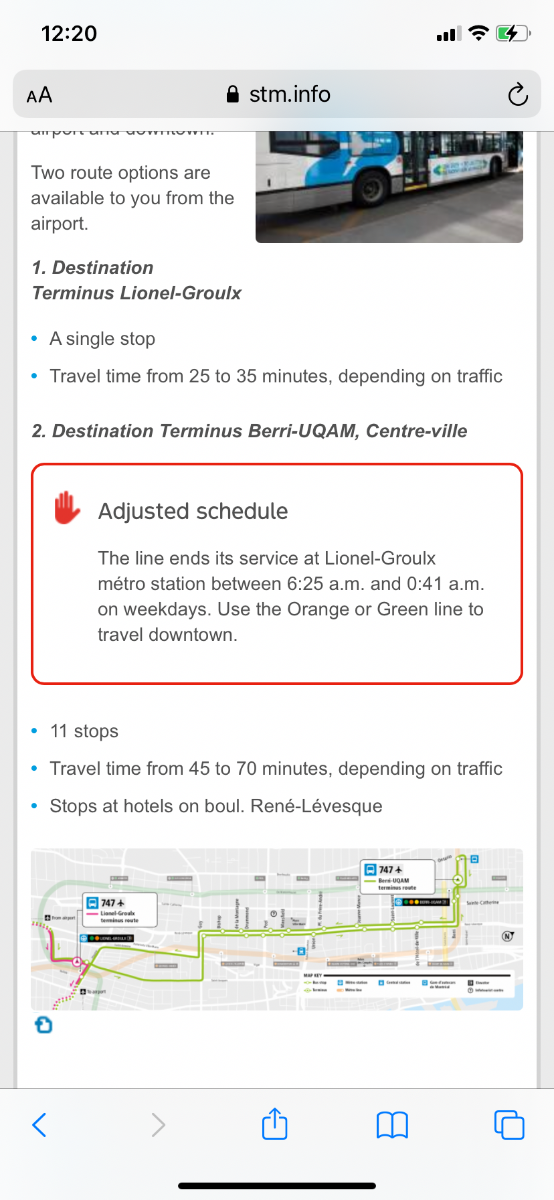
I saw the 747 restriction (see screenshot) but went to STM trip planner trying a weekend and a weekday and all the stops are functioning, not just for outside subway hours. I called STM and rep said all is functioning. She could not find the same restriction I found on their site. I also could not find an equivalent page to screenshoot for downtown to YUL direction, so not sure whether L-G is the default embarking. She said things changed related to the pandemic on Aug 23rd, so it is perhaps now an outdated restriction. Sorry it’s still ambiguous. I’m a block from René-Levesque so I’ll sit with a coffee sometime this week for intel recon.
-
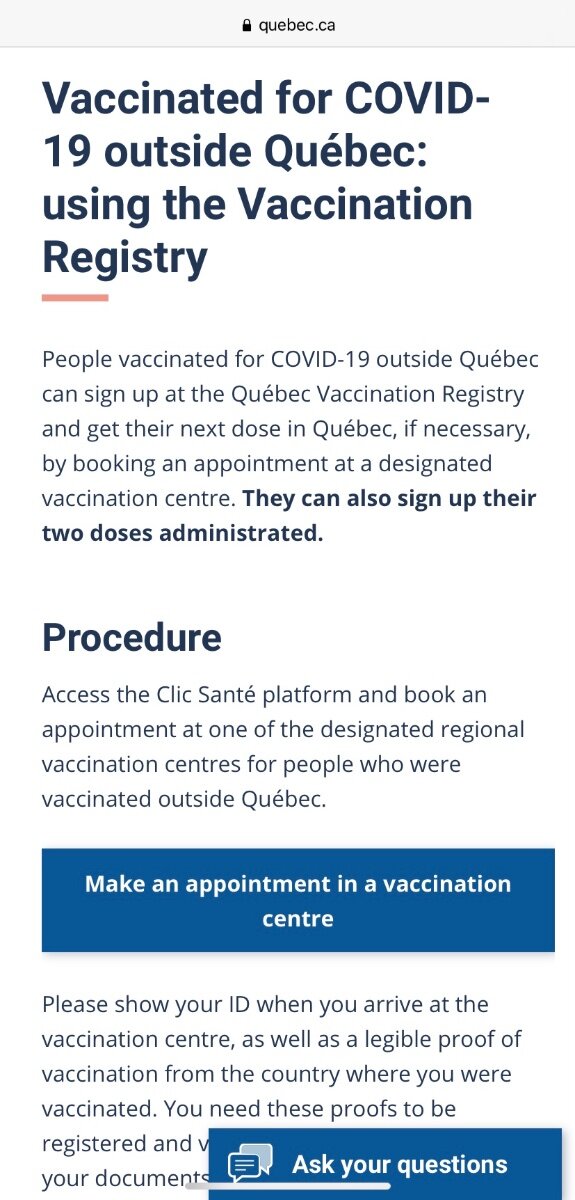
BTW according to the press conference yesterday you will need proof of address outside of Quebec along with ID and vacc documents. Not everybody keeps address proof on their person. I don’t have such info on my typical photos IDs so I usually use a tax statement.
-
It’s a bit confusing because there may be only certain provincial sites that do it and it appears you have to fill out the online form to figure out where, etc …
-
I think that being organized on paper is a solid start, maybe a screenshot of your photo ID positioned next to your vaxx receipts. I think that by that 3rd weekend the kinks should be worked out and most venues will have had to screen Ontarians. They want your business. I am personally disqualified because my vaccination trial site is just giving me a cover letter that likely won’t be worth the paper it is typed on. I am not too perturbed and won’t be carrying a placard and marching about it. There are rumblings that vaccination sites may be equipped to issue cards or QR matrix codes to out-of-province visitors. This would be the closest, the next closest being Palais des Congrès.
-
Montreal is back to case levels of three months ago, when restrictions were not lifted or about to be. Right now is a window of time without restraint, and relatively higher risk of transmission, as it’s a ‘last hurrah’ before the vaccination mandate for venues kicks in for the Labour Day weekend.
-
More developments, though still in progress, for Quebec vaxx passport equivalency for tourists. Authorities still trying to see if it can be worked out for foreign nationals through the ArriveCAN app. They are also looking into whether those visitors or those from other provinces can bring their verification to a provincial vaccination site and be issued a QR matrix code … or a card, as Québecois will also have the option of a card as opposed to a smartphone code. The vaxx sites are not too busy and accommodate walk-ins. Still, it will likely take some time for those staff to get up to speed on what to do with such requests.
-
FullSizeRender.mov FullSizeRender.mov
-
I’m Canadian but Americans I know have had to provide negative NAAT to re-enter USA, at least for trips where the USA-based test expires and cannot be used to return. There is also a complicated distinction based on days not hours. You need RT-PCR and vaccination to enter Canada, and need complete the ArriveCAN app, but I understand a negative antigen test will suffice for going back. However, the standard test in Canada is PCR so I don’t know how you’d pick a different NAAT option Canada-side; we don’t do antigen here to accommodate the American more flexible set of test criteria. Why don’t you research it rather than banking on somebody here to experientially describe the process? USA entry regulations for nationals are clearly laid out by your own government. As of Sept 1st Quebec you will need a ‘vaccination passport’ to go places, that still needs to be fine-tuned in terms of how non-Quebecois will be assessed, scanned, etc. It is a new endeavour and the priority is pandemic control not smooth tourism. Expect growing pains and screw-ups that may hit you given your dates. Keep looking up using your words on search engines.
-
So a leisurely 7 hours of the card game solitaire on the border.
-
Up until 10:30 PM none of interest to me. A few more to my liking rolled in later than the usual ‘shift change’ days gone by. One a physique competitor dancing a few years now that brought a gym buddy first-timer. Couldn’t dance for his supper, knew it, and hammed it up on stage. Hot enough bod. A Bridezilla would have annulled it all at the point of the wedding reception couple dance. I don’t go week nights. I doubt it flies and I think the DJ has resorted to music videos on the big screen as fillers, between extended durations of dancer absence, judging by Friday evening around 21:00-21:45.
-
I went to Campus Friday after a few weeks of not bothering. It has certainly picked up in attendance and energy. It appears that women have access all nights now. I have no issue with it and one cannot fault the venue for trying to uptick capacity. You may recall that 281 Club for them closed a few years ago. Campus now charging entry again $6.00 on Friday; I don’t know what other nights. I did not go into Stock but there was still none of the past spilling out of dancers outside in front that had usually conveyed the ambiance inside. BREAKING: ‘vaccine passport’ for venue admission fairly solidly in the works for the province. Québecois will have a matrix QR code or likely also an optional non-digital attestation. I do not know what certification format for foreign nationals will satisfy the criteria or if it will be somehow integrated into the mandatory ArriveCAN app info completion, but best to be organized and not caught off guard because entry into bars etc will not necessarily be exactly the same as arrival control and online prep for such. Also bear in mind there is no guarantee the government will not backpedal on the recent re-opening to foreign nationals. Addendum: I forgot to add that I am not aware if documentation of natural post-infection immunity will suffice. A lot of moving parts and the implementation is likely weeks away.
-
From what I could discern during a few brief visits: Masks mandatory when circulating from one point to another. Masks optional when stationary; sitting or standing drinking or chatting with friends or a dancer. Private dances same as pre-pandemic.
-
They are all open; the question in the thread title is answered. Nothing more to know, at this point, after 12 pages. LOL. It might be a good idea to start a new topic, such as Montreal Strip Club Reviews.
-
Good research science literacy, awareness of emerging trials and study entrance points for vaccine candidates with diversity of technology and less dependent on cold chain, few Canadians participating in the agenda, solid chance of receiving promising prophylaxis months ahead of projected vaccination rollout at the time, confidence in self-efficacy regarding avoiding infection, symbolic reference group affiliation offering a sense of contributing meaningfully and altruistically at an additional level beyond collective behavioural mitigation.
-
Apart from notions of who wants and who does not want either side entering, and reasons for vaccine uptake acceleration differences, the data as far as net full vaccination to date support this view. The nation-specific differential is about 48% vs 40%, but Quebec at 35% is way behind about 20 states that have reached a range of 50-75%. But now it’s more about individual willingness than supply or infrastructure capacity.
-
Breaking: The province is seriously considering the vaccine certification route for bars, clubs, restaurants etc, but likely not before September 1st. It may depend on case incidence rising again as well as evidence that cases are predominantly among the unvaccinated. I think that there would be provisions worked out for natural immunity based on infection and recovery, both that category and other reasons for vaccination exemption documented by one’s physician.
-
Well I’ve meandered through The Village a few times over the past 3 weeks and the showing in terms of the stage and, more importantly IMO, selection scene is quite poor. Using the early 2000s as a peak (ie, 10/10) benchmark I can now be no more charitable than a 2/10 net rating. The effort of 4 establishments open at once on certain nights … Campus, Stock, Expose, Taboo seems simply unsustainable. I am not prepared to camp out for full evenings and every night in the hopes of ‘coming’ (pun intended) upon what these days would amount to a unicorn. If you are accustomed to the heyday standard, save your airfare. Perhaps it will improve a bit if and when visiting Americans add to clientele volume.
-
I may do a walk-through at Stock this week. I may even splurge on a nice meal out since I’ve likely saved thousands of dollars I otherwise would have spent at the strip clubs over the past 15 months.
-
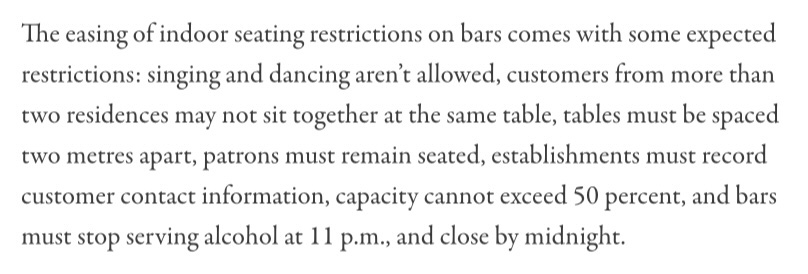
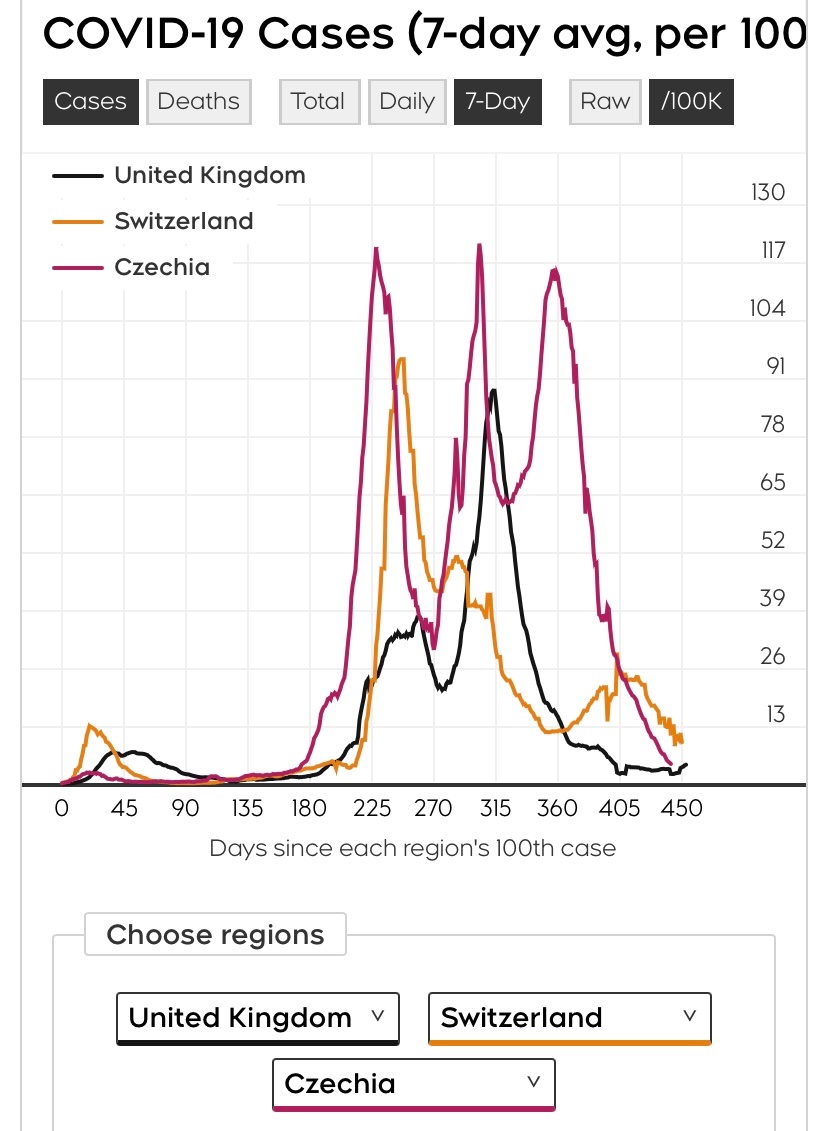
As TassoJr said, Paragonya opens tomorrow. Max indoor 100, I believe, likely because it serves food, though as a spa there may be capacity-by-footage restrictions. Entry to Switzerland is complex as Dan suggests. Czech Republic allowed because the differential of ave daily case incidence per 100K is less than 60 compared to Switzerland (currently 10). But that does not mean all countries based on that metric are permitted. After all, 50 is a difference of 40 but still 5 times Switzerland’s rate. UK is newly restricted; low case incidence BUT a variant of concern. Foreign nationals not restricted based on their country origin or their arrival from a different country that is not restricted can bypass quarantine and testing if recovered from COVID or fully vaccinated within previous 6 months. But the list of allowed countries changes regularly. RT-PCR testing before departure and after arrival may be needed depending on mode of transport into the country; I think it is air. Vaccination is really accelerating, almost best in show of daily rate globally, after a slow start. The risk of minimally one currently infected person within a group of 50 occupants is about 15%.
-
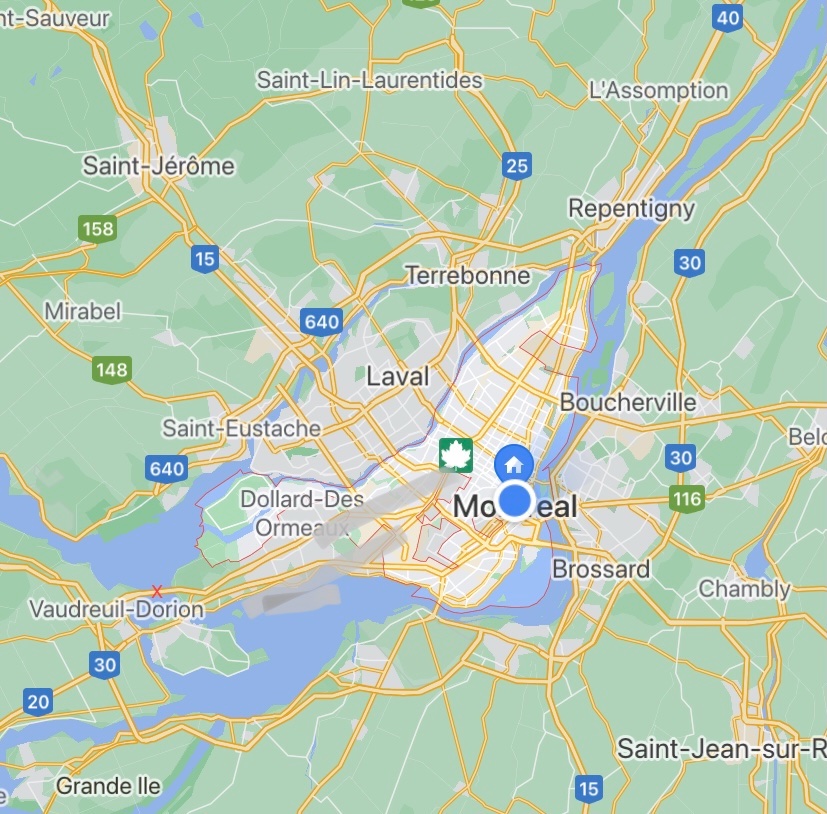
There will always be a way to drive in. I marked a little red x on the bridge (Hy 40) that is closed. Alternate highway configurations to other bridges to the island will just take longer due to congestion and/or more circuitous routes. It is premature to determine the future of the closed bridge (that will likely soon open a lane each way). Suffice to say it is making commuters livid. Parenthetically, VIA Rail crosses on the bridge (Hy 20) just a bit south and parallel to 40. South of that again is Hy 30 that eases around to the south shore and is another route typically taken from the west when the 40 bridge is out; its tolls are waived for now due to the disruption.
-
I was getting antibody-tested periodically, then this scolding. Often many sides to a question. Still, though, I’d be inclined to sero-sort a hire, even offer to pay the fee for IgG-inclusive assay because it is uninsured where I live. https://www.google.ca/amp/s/amp.theatlantic.com/amp/article/617981/